In the previous post, we showed the three W’s of data collection. Now that we have the data, we need to process it and make a portion of it accessible to the end users. The DFTB project collects a lot of information from the supply chain. We aim to present all this information to the end user using the blockchain mechanism.
The concept of the blockchain allows anyone to access the data and read everything at any moment. But, the stakeholders have different interests and want to see other aspects of the data.
The decision of what data to show and how to present this data to each stakeholder goes through understanding the system specifications.
The developers and the user experience professionals must create a system that lets those distributors access the information they need.
For example, distributors want to receive the fruit as closely as possible to the picking date. Another everyday use is the customer in the supermarket who wants to scan a fruit and understand in a few seconds whether it will taste good or not. If they have to analyze the status of each fruit, they will probably give up on using the system and go back to guessing, as they did before.
Lastly, the supermarkets can use this system to allocate different prices according to the quality of the fruit.
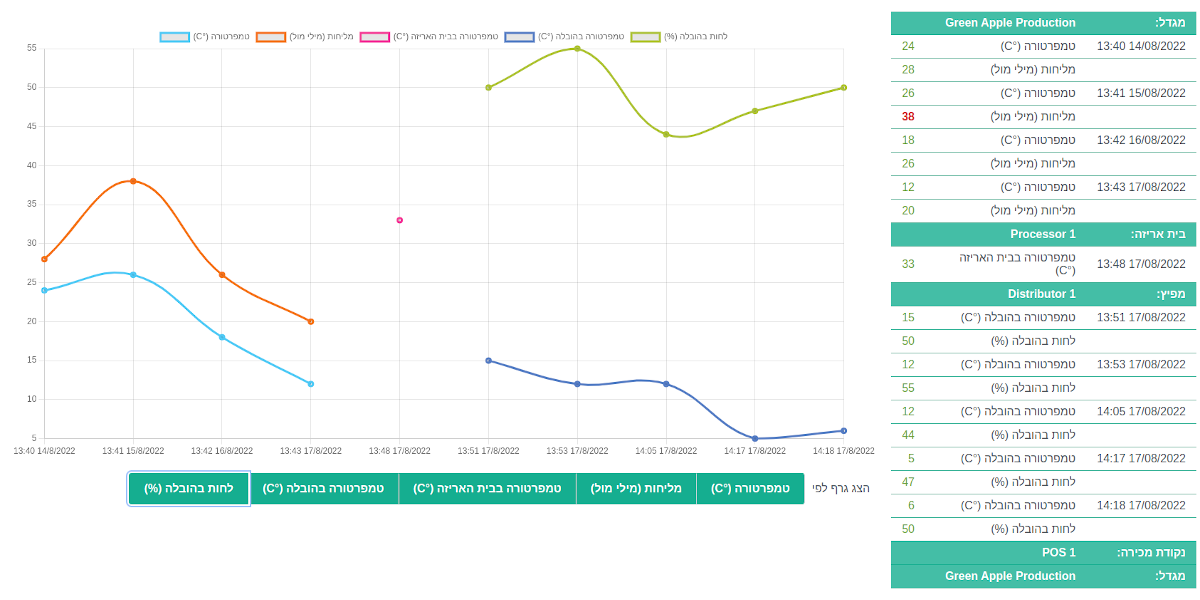
There are several analysis options. In the DFTB project, we use charts with maximum and minimum bars to show whether the fruit was in good condition along the supply chain.
For example, we use a color bar on mangoes from yellow to green to show the status between sour and sweet. The consumer in the supermarket can scan the fruit and decide whether or not to buy it based on their personal taste.
The advantage of such charts is that you don't need a powerful server to calculate the parameters. Any smartphone can draw these charts in a browser using data from the blockchain network.
We at Hadas Bar suggest another option based on artificial intelligence, which will run on a traditional server on the cloud.
The AI solution will help the customer at the supermarket or the worker at the packing house achieve the best possible results.
The customers will scan a group of fruit together, and the system will break it into different QR codes and tell which fruit will suit them best.
The AI system can determine what taste each person likes in each fruit. Of course, this system must consider data security and the users’ privacy since it is sensitive data.
Customers can always use the chart option and choose a different product if they are inclined - for instance, if they want to buy a cheaper fruit with a slightly different taste or if they’re shopping for someone else.
On the other hand, this system can help the packing house (the processors) divide the fruits into several types.
In short, the DFTB project produces a lot of data and saves it on the blockchain network, so it is open to everyone. We found several solutions to present this data in a practical and aesthetically pleasing way.
This project has received funding from the European Union’s Horizon 2020 research and innovation program under grant agreement № 818182
Lets get in touch. Send us a message: